
(cet article existe aussi en français 🇫🇷)
Not easy to be an administrator of a LinkedIn page… So when a reference study defines the best practices of the moment (rhythm, formats, contents, tools, sections, ads…), we analyze them on the spot!
No! The 4th annual benchmark study « LinkedIn Algorithm Research » was not just about profiles. This report, established by Just Connecting, the international hub of LinkedIn experts created by Richard van der Blom and of which I am a member, also analyzes the LinkedIn pages of companies, brands, institutions…
And this report based on the analysis of 400 pages since 2018 allows to draw at least 10 best practices to follow when you are admin of a LinkedIn page.
Subscribe to « The InfluX », my ENG monthly newsletter on and about LinkedIn

1. Publish 4 to 5 times a week
The best frequency for a business page is to publish 4-5 posts per week. If you publish less than 2 posts per week, your growth will be reduced by 50%.
You can publish several posts per day without affecting the (average) reach of previous posts. This is not the case on an individual profile. If you post more than once in an 18 hour period on a personal profile, you will be penalized.
FYI, 74% of company pages with more than 1,000 employees share content weekly, up from 69% a year earlier.
2. Publish on Tuesdays, Thursdays and Saturdays
The best engagement days for company posts are Tuesdays, Thursdays and Saturdays.
Publishing on Mondays and Fridays reduces reach by 25% and a 70% drop on Sundays.
Not available on the right days? Be aware that publishing on LinkedIn via a third-party scheduling tools (Hootsuite, Buffer, Agorapulse…) is no longer penalized by a loss of reach. In fact, LinkedIn is working on launching its own free scheduling tool.
3. Mix the content formats
Using all the different content formats (image, video, document and article) increases reach by 10%, with images and external links being the most shared content on pages.
Compared to posts from an individual profile, polls and documents perform less well, but videos, external links and posts with multiple images perform better.
As a reminder, the best content formats are, in order, documents (PDF), polls, carousels and posts with multiple images.
4. The 7 best content pillars
Here are the 7 most used content pillars in successful content strategies… ranked by their reach and engagement rate with a score (1 being very poor, 10 being the highest).
- Personal stories (9/10) – stories about employees or customers, informal activities, team building,classes, etc.
- Employer branding (7/10) – content from « personal stories » can often be reused here. Information about career opportunities, open positions, projects and what to expect when working with us.
- Social responsibility (6/10) – how the company addresses sustainability, circularity, equality and what standards and values are supported.
- Thought leadership (6/10) – white papers, research, in-depth articles, downloadable content and e-books, etc. (i.e. corporate content created by the marketing department).
- Industry-related content (5/10) – this pillar is great for repurposing third-party content, informing your audience of developments, trends in the industry without always having to use your own content.
- Events (4/10) – to inform your audience about events/activities your company is organizing (offline/online) and how people can participate. But also what events your own employees (sales) are attending and why.
- Product and service related content (3/10) – articles, posts and videos about product features, new releases, demos, etc.
5. Invite comments under your posts
Posts on a company page are shown to an average of 2.4% of your followers in the first 90 minutes of their lives. And it’s essentially the engagement of this exchange that determines the viralization of posts. But not all interactions are created equal. Provoking comments is the most effective tactic.
- A comment under a LinkedIn page post is 12 times more powerful than a share
- A comment under a LinkedIn page post is 8 times more powerful than a like
- A comment under a LinkedIn page post is 6 times stronger than clicks on « see more »
However, when a comment is left by employees, the impact on reach and performance of a LinkedIn page post is reduced by 30% compared to non-employee comments.
Another tip to accelerate the growth of your post in the first few hours: use « Targeted Audience« , which makes the sample (minimum 300 subscribers) significantly more relevant.
6. Comment at least twice a day as a page
Since last year, LinkedIn allows to engage from a company page on other publications. Liking and commenting on an employee, vendor or customer’s post will greatly increase the page’s visibility.
Two comments per day increases the reach of your own posts by about 8% and five comments per day increases your reach by 15%.
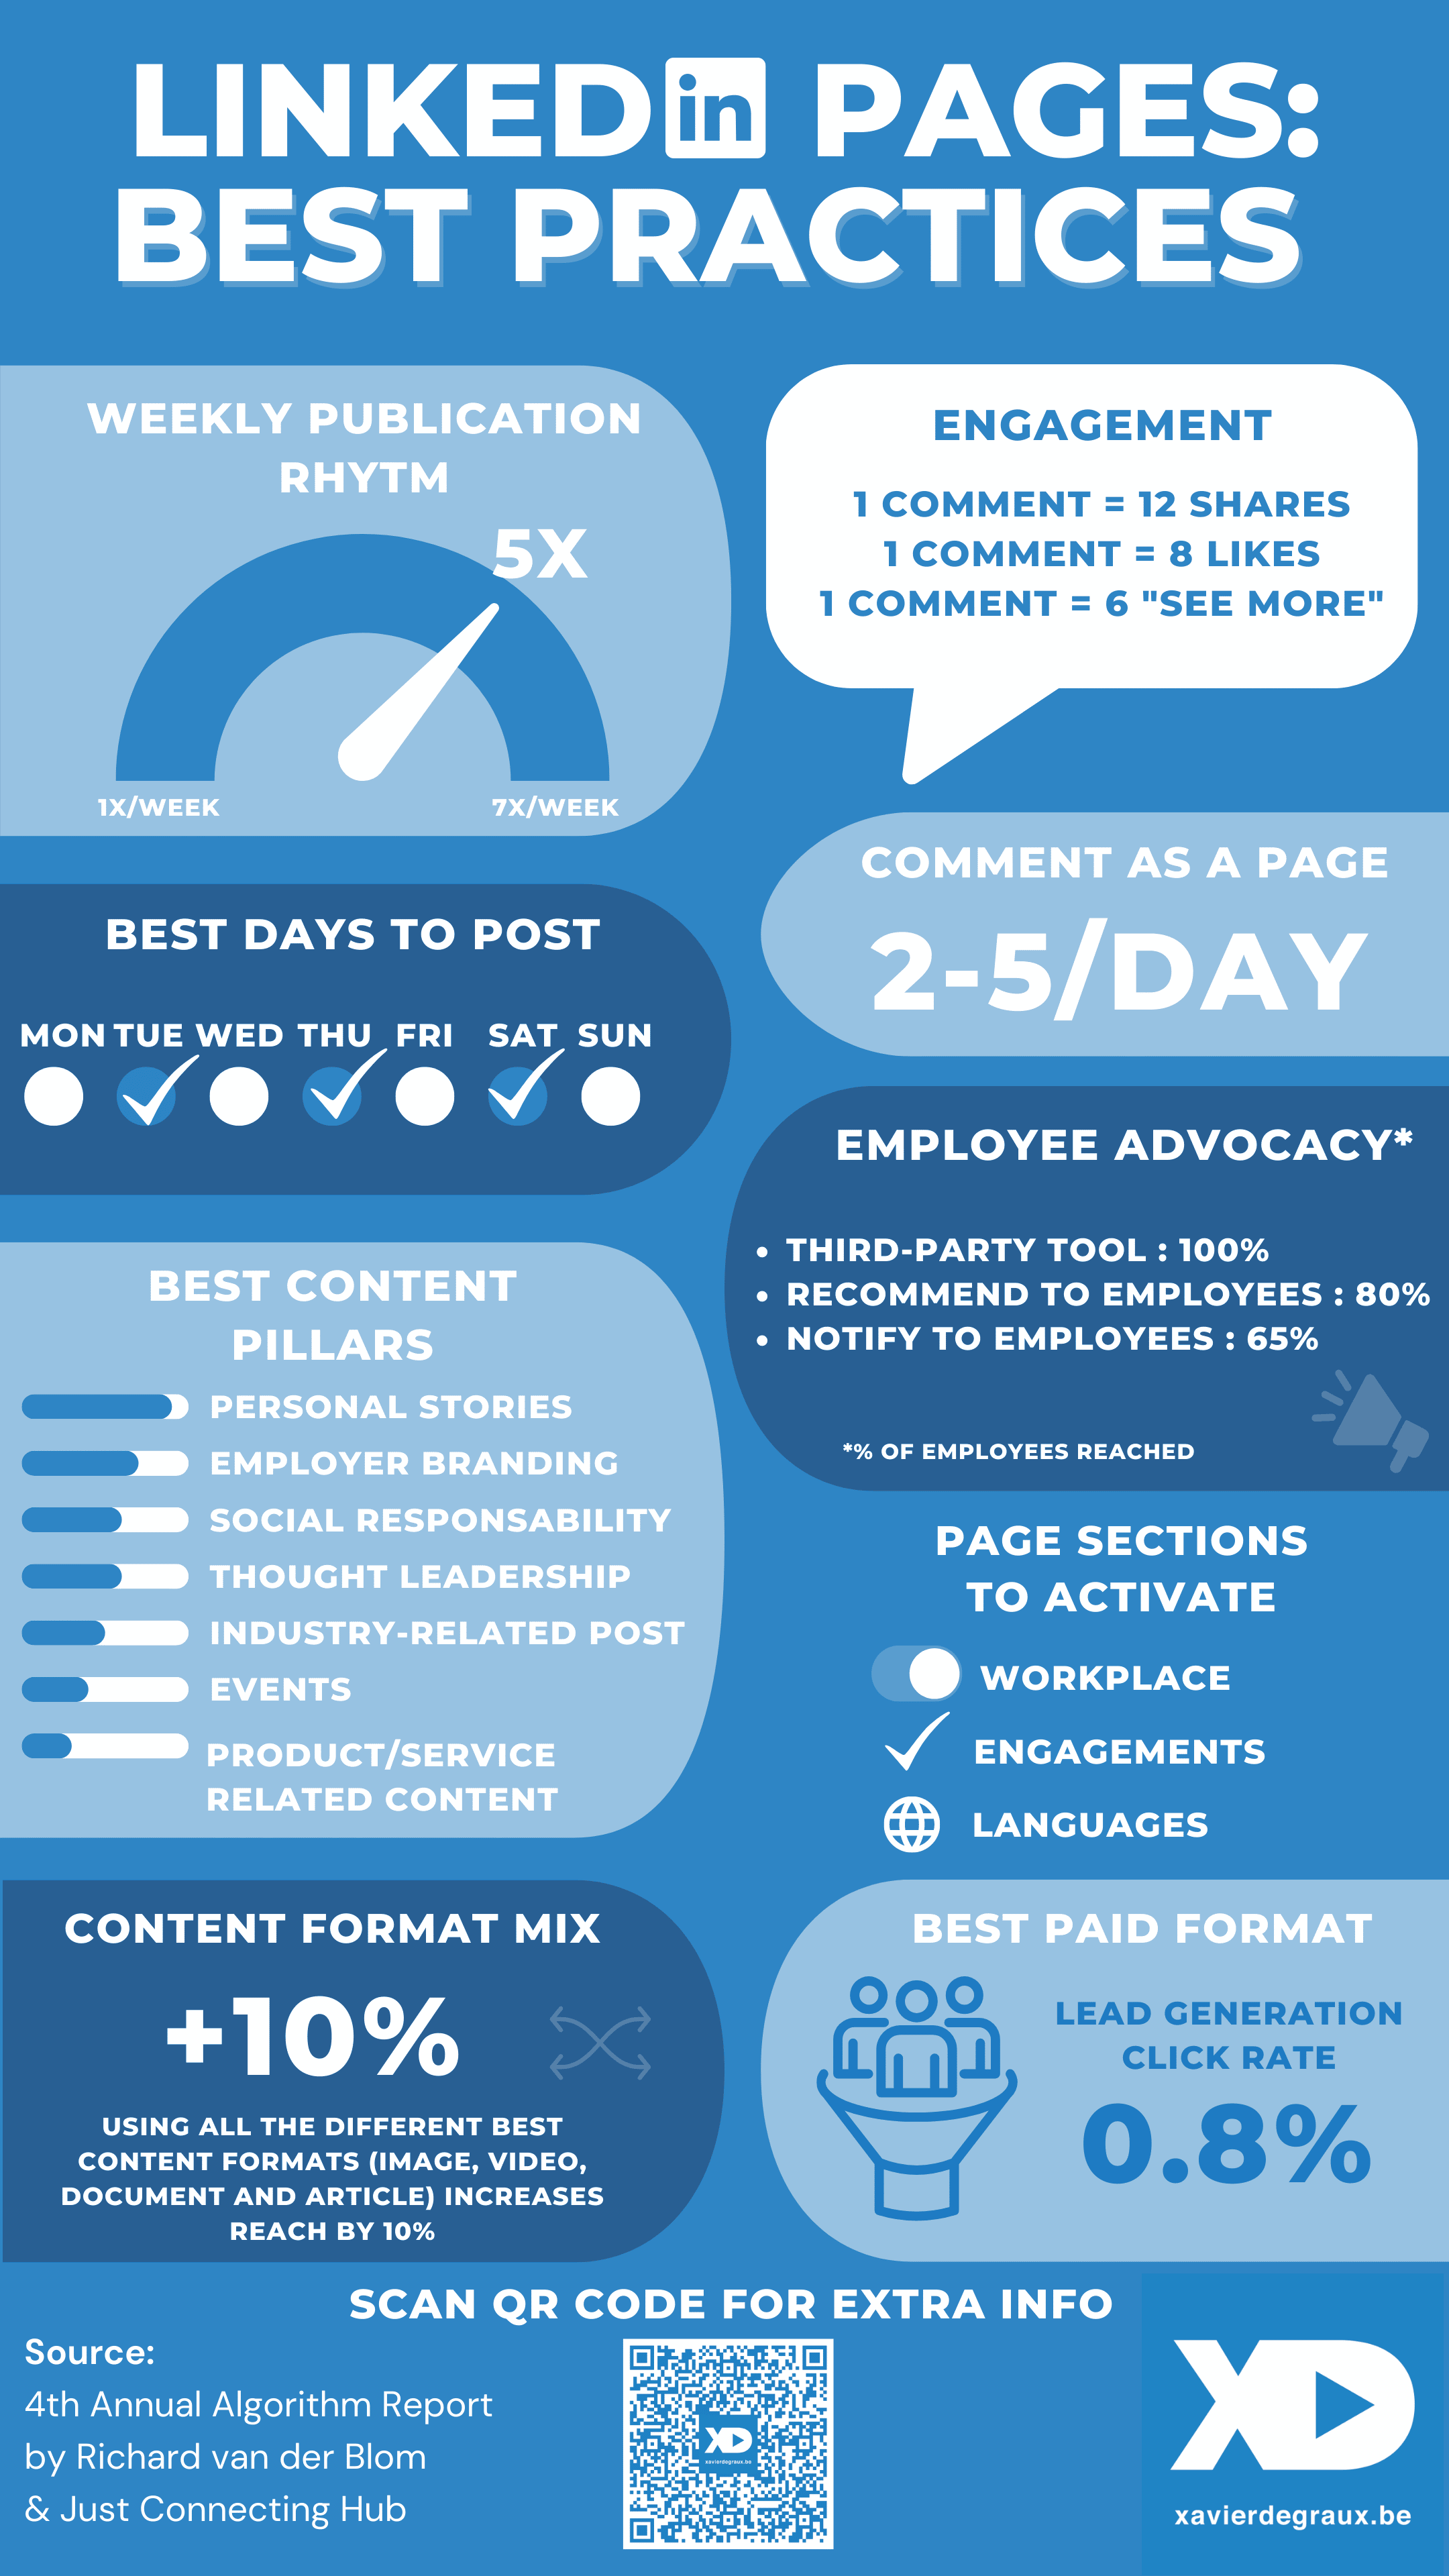
7. Employee advocacy: use a third-party tool
Invest in an external Employee Advocacy tool to ensure you reach all employees, including those who are less (or not at all) active on LinkedIn. You’ll get up to 4 or 5 times more results than using LinkedIn tools alone.
No particular reason:
- When you use « Recommend to Employees, » LinkedIn notifies about 80% of all employees (who are connected to the correct company page).
- « Notify Employees » only notifies 65% of employees
FYI, the average engagement rate of LinkedIn pages is up 15% from a year earlier. Employee advocacy plans have come a long way… Including the ones I set up 😉
8. Complete the (new) sections
Recently, LinkedIn added new sections to a company’s page, like « Workplace » and « Engagements« . Pages with these sections completed get a 5-10% higher score.
If you’ve added the « Lead Gen Form » to your business page, the best conversion option is « Get Started, » followed by « Start Free Trial. » The other options, « Request a Free Demo » and « Contact Sales », are respectively 3 and 5 times less performing.
Another important section to complete (but older): Languages. Pages that are configured in multiple languages perform 10% better in terms of reach and up to 20% better in terms of engagement.
9. Combine paid and organic
When a company has active campaigns (running ads), we see a 15-20% increase in reach and engagement on organic content. This may have nothing to do with the algorithm, but could be due to the fact that after seeing the ad, more people visit the company’s page for more content and information.
On average, the conversion rate on LinkedIn ad campaigns is at 0.44%.
The ad that converts the most (in terms of clicks) right now is the Lead Gen form add. The average engagement rate is 0.8%
1O. BONUS : Leave it alone (or almost)
- Your community hashtags (3 maximum that appear on your business page). They have no impact on the reach or performance of a page. And they are no longer relevant, as LinkedIn now allows you to interact, as a page, with any publication.
- The different administration roles. They have no influence on the performance of the post. All roles are treated the same.
- Corporate newsletters. Although quite recent, they are not very efficient. They grow 6 times slower than personal newsletters and have significantly less reach and engagement.
- Invitations to follow your page (250 credits per month reserved for admins).Acceptance rates are currently between 6 and 12%.
- LinkedIn Live. Broadcast on a company page, their average engagement rate is 2.1% (versus 3.4% for a personal profile).
- Events. Their visibility has decreased enormously, which is explained by the fact that it is no longer possible to create messages around the event and by the difficulties linked to the obligation to register on another platform to broadcast them.
- Showcase pages. Average engagement on showcase pages has dropped again. Compared to 2021 (-30%), while from 2021 to 2020, the decrease was already 80%.
- Product pages (only available for companies active in specific sectors). Their organic visibility is very low. And they are very little used for the moment.
If you enjoyed this free article, please share it… on LinkedIn, preferably mentioning @Xavier Degraux @Richard van der Blom or @Just Connecting. Thank you!

